



Ready to Hit the Road in Style?
Save money and reduce emissions with vehicles designed to deliver exceptional mileage. Visit our inventory and find a car that fits your lifestyle.
Ready to Hit the Road in Style?
Save money and reduce emissions with vehicles designed to deliver exceptional mileage. Visit our inventory and find a car that fits your lifestyle.
Walk onto any car lot and the conversation drifts to engine size, trim levels and screen size within about a minute. None of it answers the question you actually turned up with: will this car still be a sensible decision in five years?
Four things decide that. Reliability, safety, performance and ownership costs. Everything else is detail. This guide explains how to read each one properly before you sign anything, using current Australian data rather than showroom talk.
Quick Answer
- Reliability: Toyota and Mazda lead across SUVs, small cars and hybrids, with Subaru strong in all-wheel-drive SUVs. Work utes are dominated by Toyota HiLux alongside Isuzu D-Max and Ford Ranger (Carify, Jul 2026). Brand track record beats badge prestige.
- Safety: A driver in the worst-rated vehicle is over eight times more likely to be killed or seriously injured in the same crash as a driver in the safest vehicle (Monash University Vehicle Safety Research Group, via CarExpert).
- Performance: Peak horsepower, 0 to 60 times, displacement and top speed have low real-world relevance for most drivers (SlashGear, Apr 2026).
- Costs: A $35,000 new petrol car loses $4,000 to $6,000 of value in year one alone (ShopBack, Jun 2026). Depreciation is the cost buyers underestimate most.
What Does Car Reliability Actually Mean?
Reliability isn't "never breaks". It's a predictable failure rate, affordable parts and a repair network that isn't a lottery. Toyota and Mazda dominate Australia's 2026 reliability picture across SUVs, small cars and hybrids, with Subaru strong in all-wheel-drive SUVs and the ute category led by Toyota HiLux alongside Isuzu D-Max and Ford Ranger (Carify, Jul 2026).
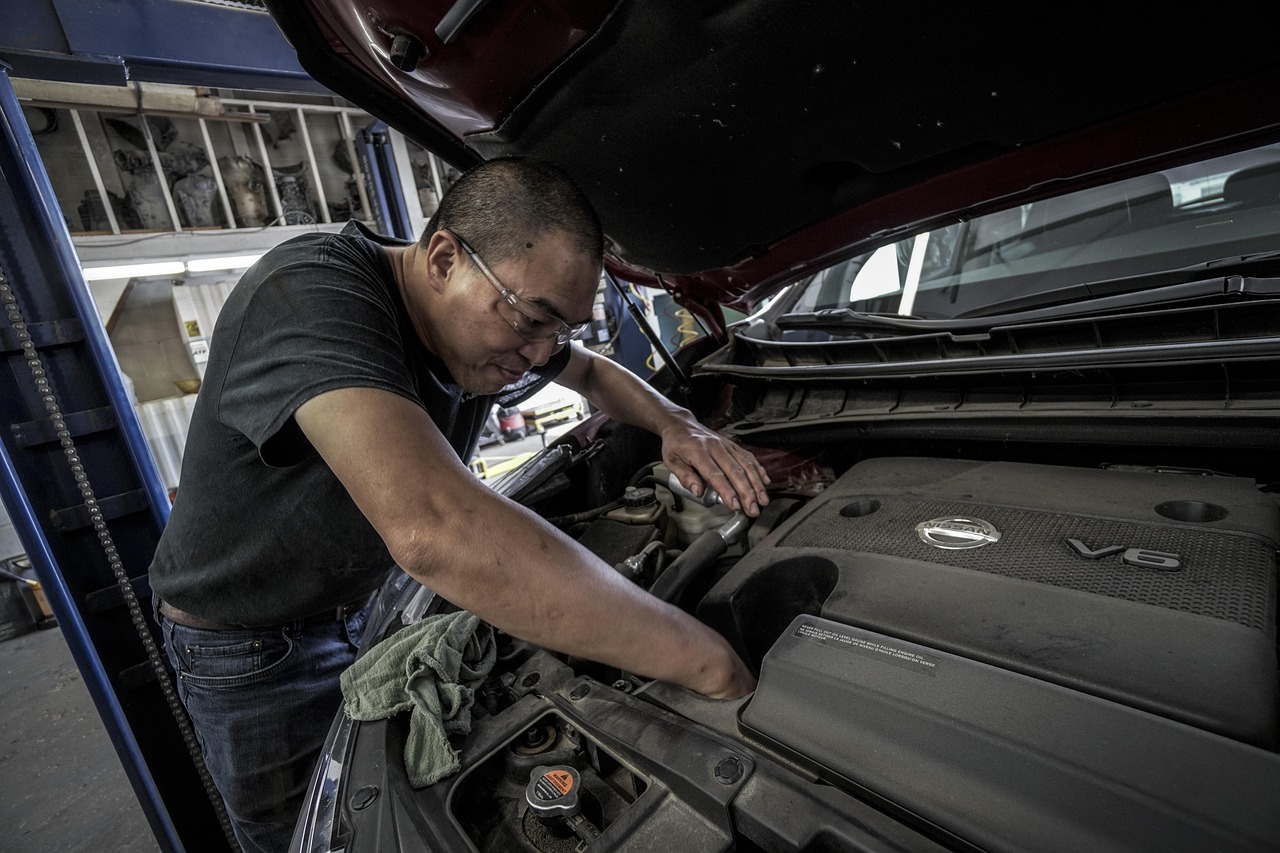 A complete service history tells you more about a used car than the badge on the bonnet.
The difference between failure rate and repair cost
Two cars can break down at the same rate and cost you wildly different amounts. A common fault on a mass-market Japanese model is a known quantity with cheap parts. The same fault on a low-volume European model can mean a three-week wait and a four-figure invoice. When you're weighing reliability, weigh both halves.
How to check reliability before you buy
Start with the service book. A full set of stamps at the right intervals tells you how the previous owner treated the car, and it's the single strongest signal you can get for free. Then check whether the brand publishes capped-price servicing, which is a decent proxy for engineering confidence.
Owner forums and the government recall database are the two most underused tools in used-car buying. Both are free, both are searchable by model year, and both surface faults that a five-minute test drive never will. Hybrids have their own reliability profile worth understanding separately: our guide to hybrid car maintenance costs and battery life covers what actually wears out.
One caution. Brand reputation and individual car quality drift apart as vehicles age. A ten-year-old example of a famously reliable make with a patchy history is still a bad buy.
How Do You Read ANCAP Safety Ratings on a Used Car?
ANCAP restructured its assessment in 2026 into four pillars: Safe Driving, Crash Avoidance, Crash Protection and Post-Crash Safety (Drive.com.au, Mar 2026). For used buyers, the star count matters far less than when the car was tested.
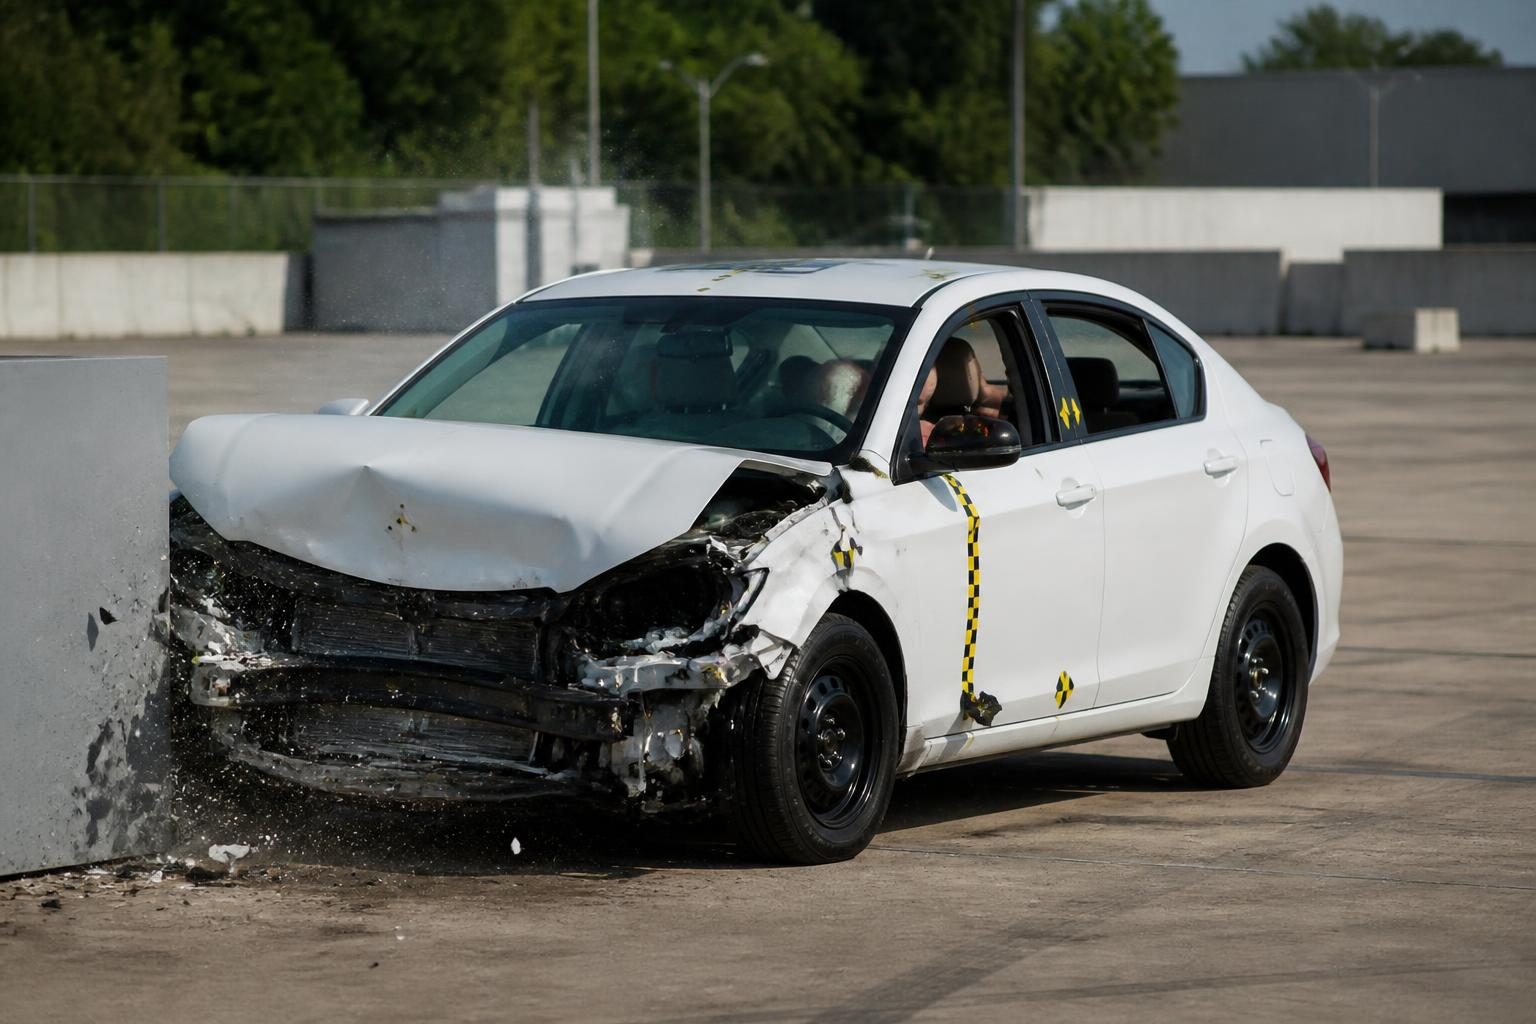 Star ratings are earned against the protocol in force at the time, which is why the tested date matters.
What the 2026 rating measures
Five stars is now a harder threshold than it used to be. Each pillar carries its own minimum:
| Pillar | Minimum score for five stars |
|---|---|
| Crash Protection | 80% or higher |
| Post-Crash Safety | 80% or higher |
| Crash Avoidance | 70% or higher |
| Safe Driving | 60% or higher |
Source: Drive.com.au, Mar 2026
The 2026 protocol also introduces an on-road assessment of driver-monitoring systems. Euro NCAP plans a 2,000 km real-world journey test as part of this; ANCAP is still developing its own equivalent procedure (Drive.com.au, Mar 2026). This is not cosmetic. Monash University's Vehicle Safety Research Group found a driver in the worst-rated vehicle is over eight times more likely to be killed or seriously injured in an equivalent crash than a driver in the safest one.
Applying the rating to a used car
Star ratings expire in practice, even though they stay printed. ANCAP recommends choosing a vehicle with a tested date stamp no older than six years (RACV, Dec 2025). A five-star result from 2015 was scored against 2015 criteria, which were considerably easier.
So when you look a car up, read three things: the star count, the tested date, and the protocol year. A four-star car assessed under a recent protocol can genuinely be safer than a five-star car assessed under an old one.
Performance Numbers That Actually Matter
Most headline performance figures are marketing artefacts. SlashGear's April 2026 breakdown named five specs with little bearing on daily driving: peak horsepower, 0 to 60 time, engine displacement, top speed and skidpad grip. What you feel every day is throttle response in the midrange.
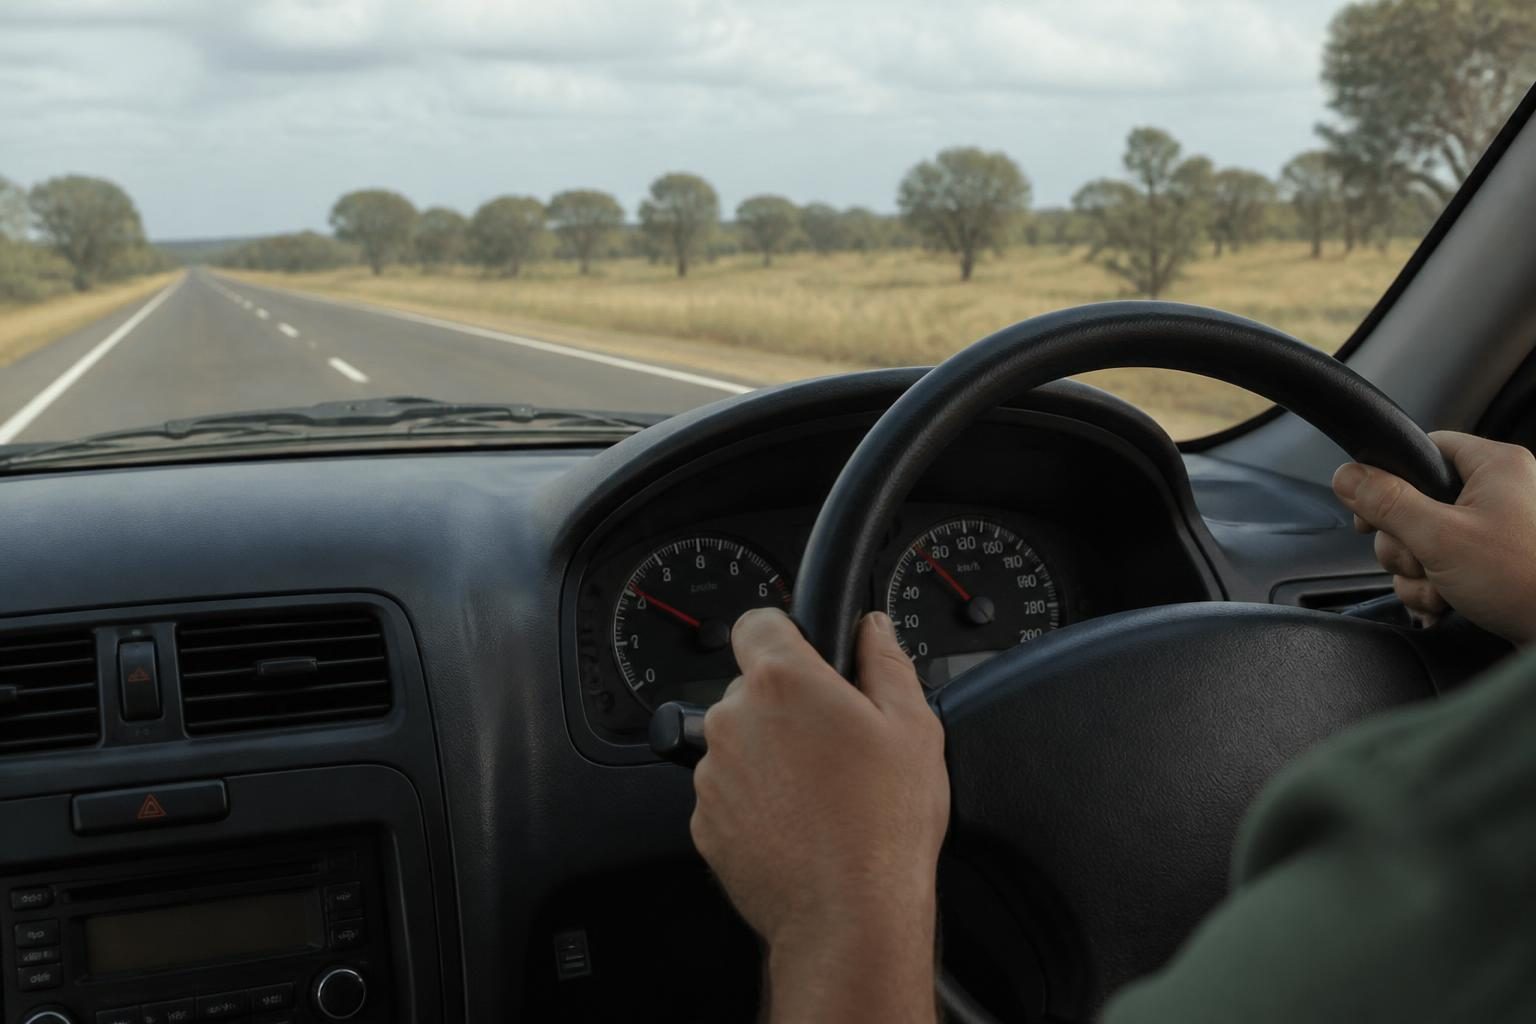 Fifteen minutes on roads you know tells you more than any spec sheet.
| Number | Marketing emphasis | Real-world relevance |
|---|---|---|
| Peak horsepower | Very high | Low, only available near redline |
| 0 to 60 time | High | Low, drag-strip conditions |
| Engine displacement | High | Low, turbocharging reverses the assumption |
| Top speed | High | Very low, legally irrelevant here |
| Midrange torque | Low | High |
| Combined fuel consumption | Medium | High |
Source: SlashGear, Apr 2026
Displacement is the clearest example of the problem. SlashGear notes that the 2026 Ram 1500's 5.7-litre V8 makes less power and torque than the 3.0-litre inline-six, and feels slower in real driving. Bigger engine, worse result.
Check the combined fuel consumption figure instead, because it converts directly into running cost. Check towing and payload if you work the vehicle. Then drive it for fifteen minutes on roads you already know. That test tells you more than every spec sheet combined.
What Does a Car Really Cost After You Drive Away?
Depreciation is the largest line item and the one nobody budgets for. A $35,000 new petrol car loses $4,000 to $6,000 of its value in the first year alone (ShopBack, Jun 2026). That single figure often outweighs a year of fuel, servicing and insurance combined.
 The purchase price is the smallest part of what a car costs you over five years.
Why buying two years old changes the maths
ShopBack's June 2026 analysis follows a $48,000 Mazda CX-5 losing $20,000 to $25,000 of value across five years, close to half of what the first owner paid. Buying a two to three-year-old car lets someone else absorb the steepest part of that curve while you get most of the useful life.
Running costs that repeat every year
Servicing is where brand choice compounds quietly:
| Brand tier | Cost per service |
|---|---|
| Toyota / Mazda capped-price | $250 to $400 |
| European brands | $500 to $1,000 |
| EV (any brand) | $200 to $400 |
Source: ShopBack, Jun 2026
Fuel follows a similar spread. ShopBack puts a mid-size petrol SUV at 15,000 km a year in the $2,400 to $3,200 range annually, a small petrol hatch at $1,800 to $2,400, and an EV charged at home at $400 to $1,200. If you're weighing those drivetrains against each other, our hybrid versus electric comparison breaks the trade-offs down further.
One number worth sitting with: 35% of Australian car owners are currently delaying a service, and 73% of those cite cost as the reason (Youi survey, via Canstar, Jun 2025). That's a lot of people who priced the purchase and not the ownership.
Which Factor Should You Prioritise?
No single factor wins outright. The right weighting depends on how far you drive, how long you'll keep the car, and how much slack your budget has for an unexpected repair bill. Here's a starting point.
| Buyer profile | Lead priority | Watch carefully |
|---|---|---|
| High-km commuter (20,000+ km/yr) | Ownership costs: fuel and servicing | Reliability and parts availability |
| Growing family, school run | Safety: star rating plus tested date | Practicality and service interval cost |
| First-time buyer on a budget | Reliability: brand record and service history | Depreciation, so buy two years old |
If two cars score similarly, break the tie on service history. It's the cheapest information you'll ever get about a specific vehicle.
How Carbarn Approaches These Four Factors
Carbarn sources vehicles from Japan, which means the reliability-first logic above is baked into the supply rather than bolted on. Toyota, Mazda, Honda, Subaru and Nissan make up the bulk of what's available, and Japanese-market cars typically carry documented service records and lower lifetime kilometres.
Compliance matters just as much. Vehicles brought in from Japan are assessed and complied to Australian standards before they reach a buyer, not sold as-is with a to-do list. You can read the detail on how compliance works.
For cars already available in Australia, browse used cars or the hybrid range. For Japan-sourced vehicles you'd like arranged, start at importing.