



Ready to Hit the Road in Style?
Save money and reduce emissions with vehicles designed to deliver exceptional mileage. Visit our inventory and find a car that fits your lifestyle.
Ready to Hit the Road in Style?
Save money and reduce emissions with vehicles designed to deliver exceptional mileage. Visit our inventory and find a car that fits your lifestyle.
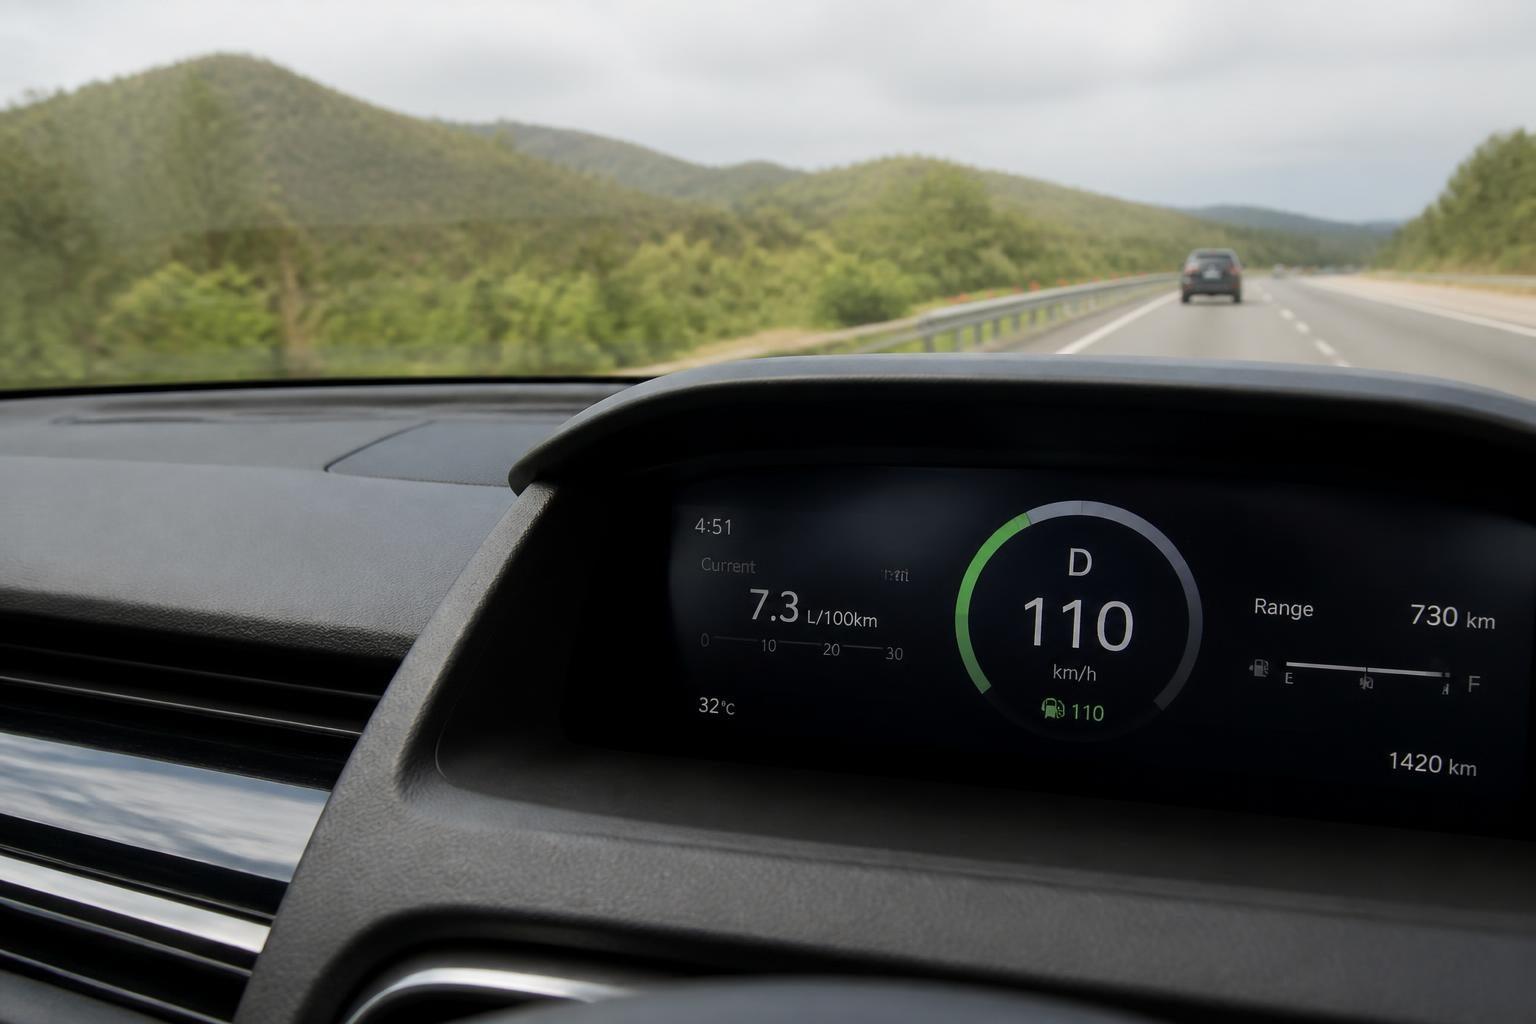
You picked the car partly on the fuel figure. The windscreen label said 5.0 L/100km, the salesperson nodded, and it felt like a sensible decision. Six months on, the servo visits don't line up with the maths you did in the driveway.
You're not imagining it, and your car probably isn't faulty. The real-world fuel economy gap — between what the label says and what you pay at the servo on a Sydney commute — is measurable, well documented, and mostly structural. This guide explains where that number comes from, what independent Australian testing has found across nearly 200 vehicles, and how to check a shortlisted model before you sign anything.
The Bottom Line
- 76% of the 141 petrol, diesel and hybrid vehicles tested by the Australian Automobile Association used more fuel than their label claimed (AAA, February 2026)
- The lab test runs indoors with the air-con off, no hills, no traffic and no passengers
- The widest single-model gap recorded so far is the Mazda 2: 6.8 L/100km tested against a 5.0 L/100km claim
- Some cars beat their label, including the Subaru Forester Hybrid at 12% under claim
- You can look up your shortlist free at realworld.org.au, no login needed
What Is the Fuel Economy Label Actually Measuring?
ADR 81/02 is Australia's mandatory fuel consumption test standard, requiring every new car, SUV and ute up to 3.5 tonnes to be tested indoors on a rolling-road dynamometer, with the air conditioning switched off and no traffic, hills or weather involved (Green Vehicle Guide). The figure on the windscreen comes directly from that lab result.
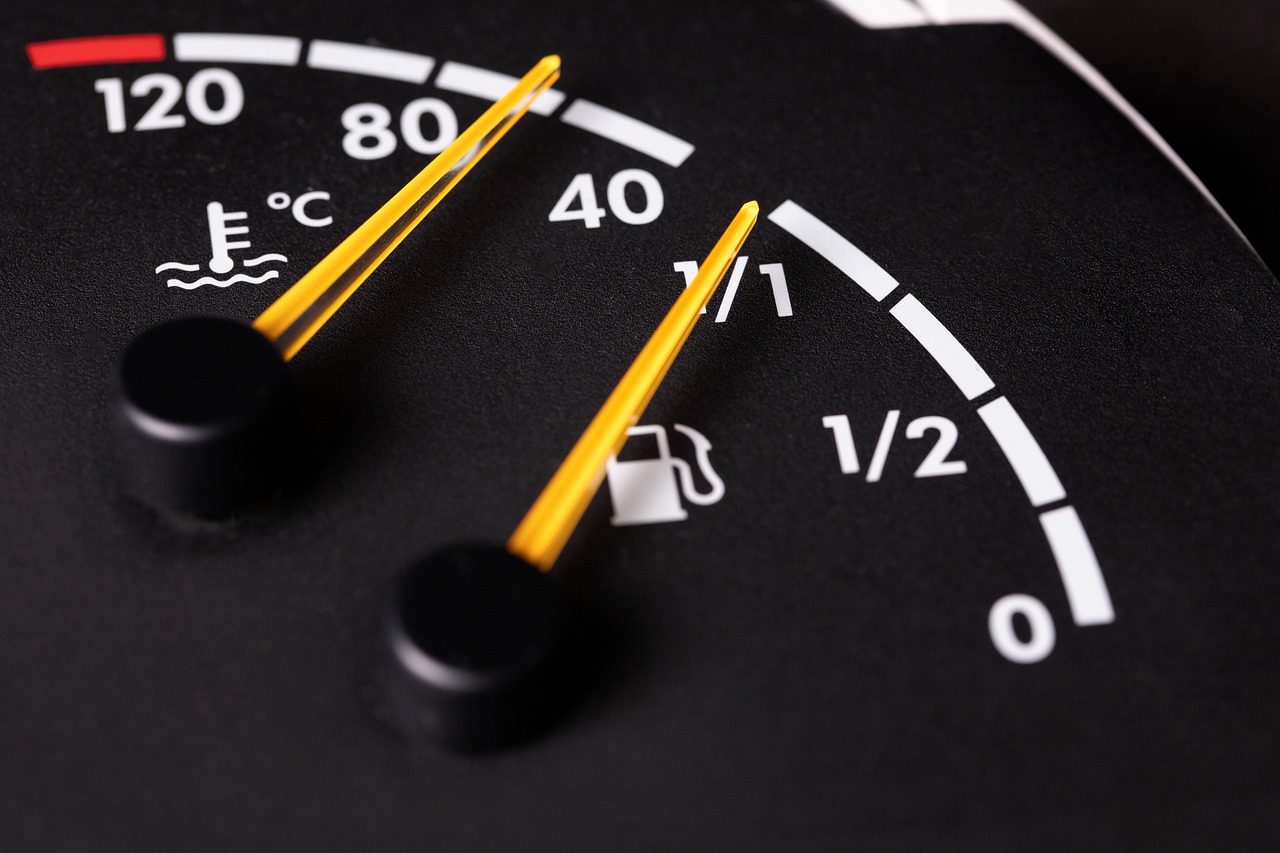 The number on the windscreen label is a lab result, not a promise about your commute.
Two things follow from that. The manufacturer submits the vehicle for testing, so it isn't a surprise audit. And the resulting figure is a legally required disclosure designed to let you compare one model against another under identical conditions — never a guarantee of what your own driving will return.
That distinction matters most when you're comparing two cars from different eras or different brands. The label is a fair yardstick, not a forecast.
What About Older NEDC Figures?
Some vehicles still circulating in the Australian used market carry figures from the NEDC — the New European Driving Cycle — an older lab test that was shorter, slower and further removed from real driving than ADR 81/02. If a used car's paperwork shows NEDC numbers, treat them with a bit more scepticism than usual.
Why Does Your Fuel Bill Tell a Different Story?
Air conditioning alone raises city fuel use by 5–10%, and by more than 25% in extreme conditions (RACV, June 2026) — and that's before factoring in hills, traffic, and a full load. The road adds back everything the lab removes, which is why a 20–30% gap between claimed and real-world stops looking surprising once you account for it.
 Air conditioning, traffic, hills and payload all show up at the bowser. None of them show up in the lab.
Here's the short version of what changes once the car leaves the building.
| In the ADR 81/02 lab | On an Australian road |
|---|---|
| Indoors on a dynamometer | Traffic lights, hills, headwinds |
| Air conditioning off | A/C adds 5-20% in city driving |
| Rollers, no real tyre friction | Full tyre-on-road rolling resistance |
| Controlled mild temperature | 38°C summer days, cold winter starts |
| Minimum kerb weight, no load | Four people, prams, tools, roof racks |
| One repeatable cycle | School run, motorway, weekend tow |
None of that means a particular car has been misrepresented — it means the measurement method deliberately strips out variables to keep results comparable, with the trade-off that the figure drifts from what you'll actually pay at the bowser.
What Did Independent Testing Actually Find?
Australia now has hard data on this. The Real-World Testing Program is a $14 million Commonwealth-funded scheme run by the Australian Automobile Association, which drives production vehicles over a 93 km circuit in and around Geelong covering urban, rural and motorway phases (Department of Infrastructure).
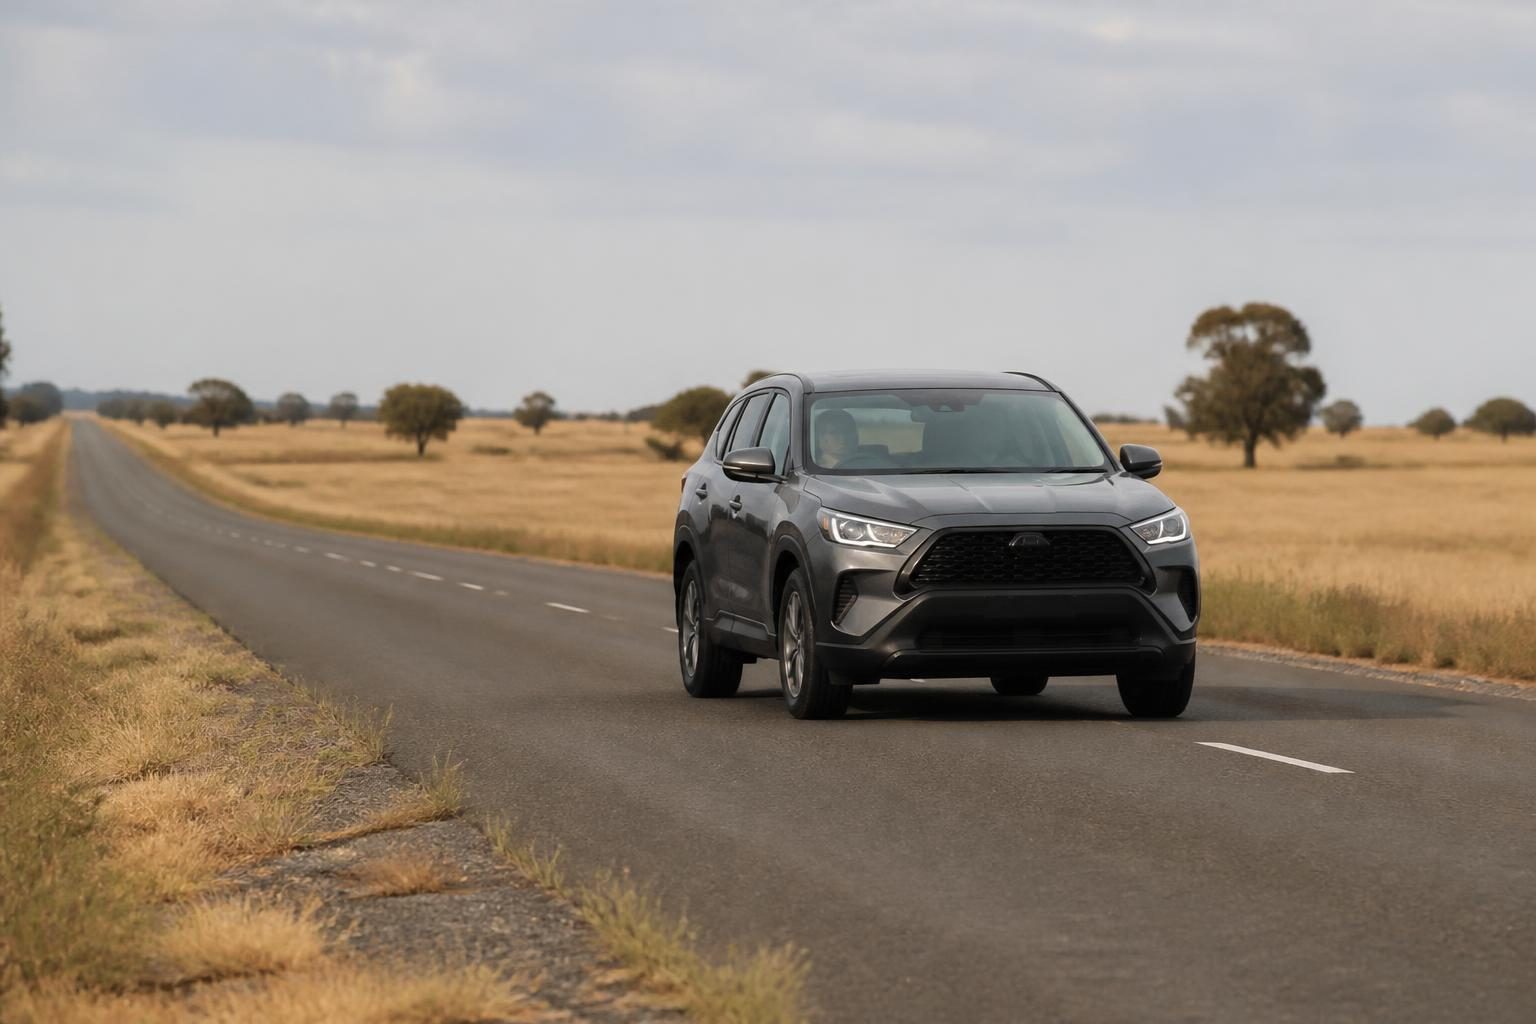 The Real-World Testing Program runs a 93 km loop around Geelong covering urban, rural and motorway driving.
Cars are fitted with portable emissions equipment and driven under protocols based on European Real Driving Emissions rules, with each result averaged across at least two runs. RACV reports the program has now tested close to 200 vehicles across three years, including 33 hybrids.
The headline numbers are worth sitting with. Across all models tested, 76% used more fuel and produced more emissions than their sticker stated (AAA, February 2026). Around one in five also exceeded the noxious emissions limits they met in the lab, according to AAA Real-World Testing Program data. Electric cars aren't exempt either: of the EVs tested, results have ranged from 3% to 31% below the claimed range, with the BYD Seal returning 488 km against a 650 km claim.
Claimed vs Real-World: A Cross-Section of Tested Models
This is a sample from the published dataset, not a shortlist or a ranking. It's here to show how wide the spread gets.
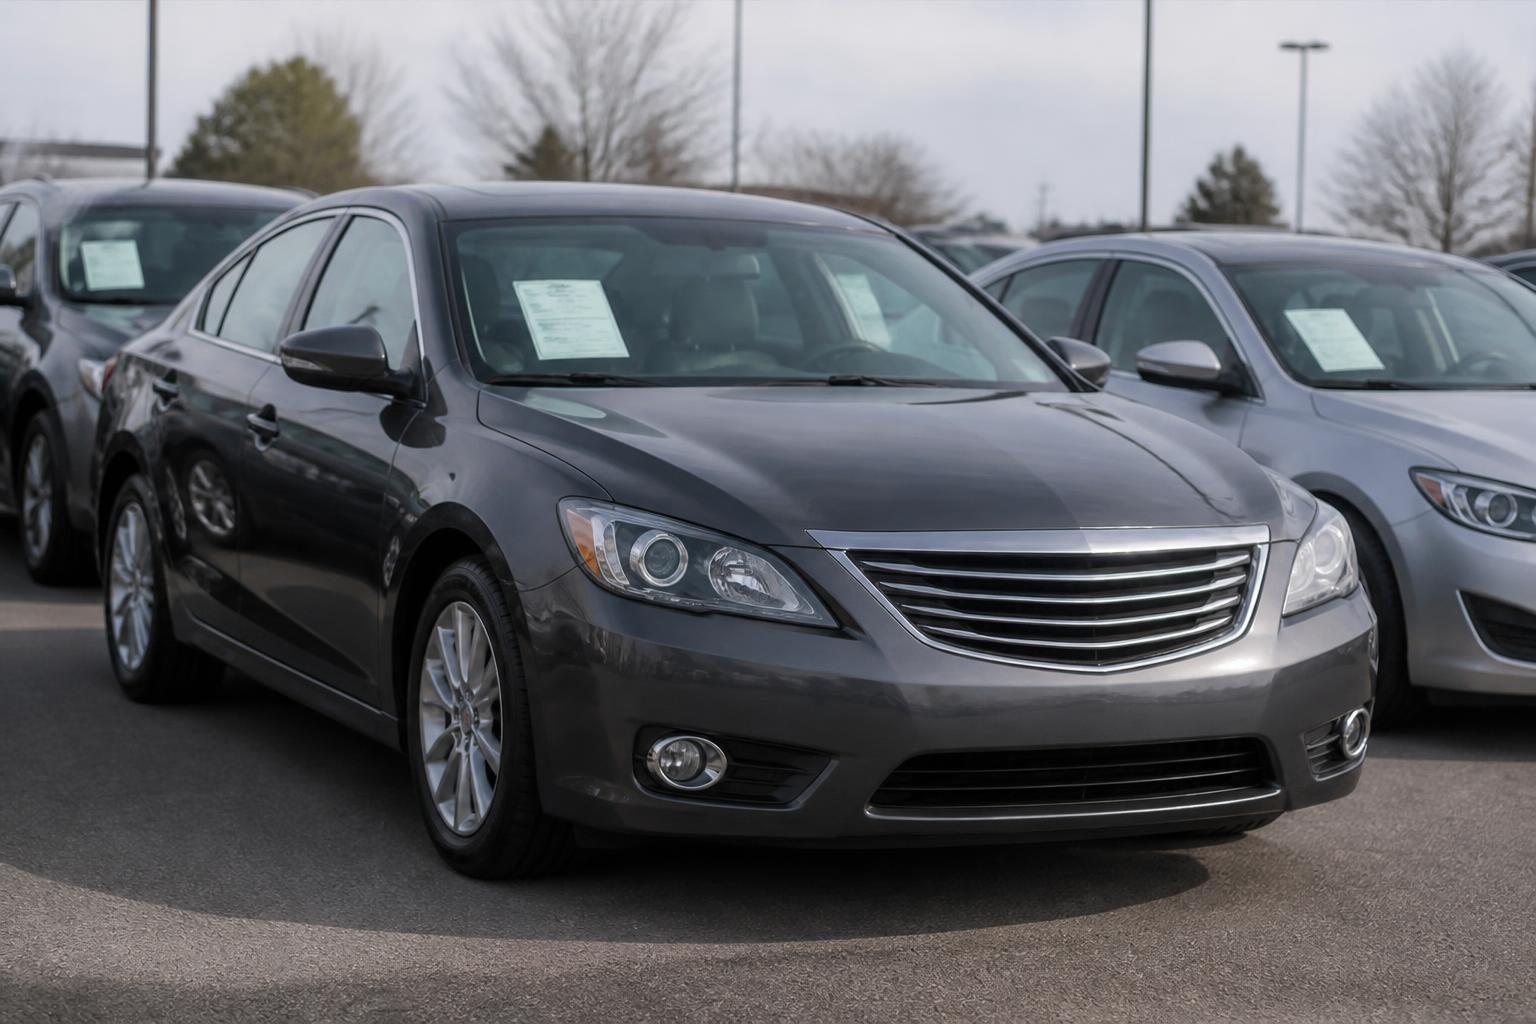 Hybrids show the widest spread of results: some beat their label, some miss it by a third.
| Model | Claimed (L/100km) | Tested (L/100km) | Gap |
|---|---|---|---|
| Mazda 2 | 5.0 | 6.8 | +35% |
| Hyundai Kona Hybrid (2024) | 3.9 | 5.2 | +33% |
| GWM Haval Jolion Hybrid (2025) | 5.1 | 6.5 | +27% |
| GWM Tank 300 petrol (2026) | 9.5 | 11.9 | +25% |
| MG ZS Hybrid+ (2026) | 4.7 | 5.0 | +6% |
| Kia Carnival Hybrid (2026) | 5.8 | 6.0 | +4% |
| Chery Tiggo 4 Hybrid (2026) | 5.4 | 5.3 | −1% |
| Subaru Forester Hybrid (2026) | 6.2 | 5.5 | −12% |
| Ford Mustang GT (2026) | 13.6 | 10.7 | −22% |
Figures published by the AAA Real-World Testing Program, as reported by RACV (June 2026), RACQ (February 2025) and CarExpert (February 2026).
Two clarifications worth making, because they get muddled elsewhere. The 2022 Toyota RAV4 Hybrid returned 4.8 L/100km in testing, which is 2% above its lab figure rather than below it. And the Corolla Hybrid hatch is not the Corolla Cross Hybrid: NRMA reported the hatch as the one Toyota hybrid in its round to beat its lab result, while the Cross came in higher.
Do Any Cars Actually Beat Their Claim?
Yes, and the exceptions are instructive. Roughly a quarter of tested vehicles met or beat their label, and three results stand out for very different reasons.
The 2026 Subaru Forester Hybrid used 5.5 L/100km against a 6.2 L/100km claim — a 12% improvement — and emitted 9% less CO₂ than stated (RACV, June 2026). That's a genuine engineering result: the previous mild-hybrid Forester actually used 10% more than its claim. The Chery Tiggo 4 Hybrid came in at 5.3 against 5.4, near enough to spot on.
Then there's the Ford Mustang GT, 22% under its 13.6 L/100km claim. That one says less about the V8 and more about a manufacturer submitting a conservative lab figure — which is the real lesson here. How a car is calibrated and how cautious the brand was in the lab both shape the sticker, so the gap isn't universal and it isn't predictable by badge.
How Can You Check a Car's Real-World Fuel Economy Before You Buy?
The AAA publishes every result free, and almost nobody uses it. It takes about two minutes.
 Checking a shortlisted model against independent test results takes a couple of minutes and costs nothing.
- Go to realworld.org.au and open the Results section.
- Search by make, model and year. Match the variant and fuel type carefully, since hybrid and petrol versions of the same nameplate test very differently.
- Read the full result page, not just the headline number. It shows tested consumption in L/100km and tested CO₂ in g/km, the gap against the claim, and the conditions on test day — including date, weather and temperature.
- If your model isn't listed, the program is ongoing and adding vehicles. Check back, or look up the closest comparable variant.
A quick example. Say you're comparing a 2024 Hyundai Kona Hybrid against a Toyota RAV4 Hybrid — both sit in the 4–5 L/100km range on the label. Search realworld.org.au and you'll find the Kona Hybrid tested at 5.2 L/100km against a 3.9 L/100km claim, a 33% gap. The 2022 RAV4 Hybrid came in at 4.8 against 4.7, essentially spot on. On 15,000 km a year at $2.10 per litre, that 1.3 L/100km difference adds up to roughly 195 extra litres — about $410 more at the bowser annually. That's worth knowing before you choose on label alone, and the check takes two minutes.
Three Questions to Ask Before You Sign
- Is this model listed on realworld.org.au, and what did it actually return?
- Does the gap change your running-cost maths enough to shift your decision? On a 15,000 km year, a 1.5 L/100km difference is about 225 litres of fuel.
- Does the label show ADR 81/02 or WLTP figures? That tells you which baseline you're reading.
What Changes From July 2026?
Australia is moving to a tougher test. Under ADR 81/03, WLTP-based fuel consumption labels become mandatory for newly approved vehicle models from 1 July 2026, and for all new light vehicles sold here from 1 July 2028 (Green Vehicle Guide).
WLTP — the Worldwide Harmonised Light Vehicle Test Procedure — is a harder test than what it replaces: about 30 minutes instead of 20, 23.3 km instead of 11, four driving phases rather than two, higher speeds, and air conditioning accounted for (carsales.com.au, 2018). Labels on new models from mid-2026 should sit closer to what you'll see on the road — closer, but not identical, since it's still a controlled lab procedure.
The New Vehicle Efficiency Standard came into force on 1 January 2025, with the compliance accumulation period beginning 1 July 2025. Credits and penalties tied to fleet CO₂ performance give brands a financial reason to close the gap rather than manage it.
Where This Fits When You're Shopping
Most people doing this research are weighing up two or three cars in one segment — usually a hybrid hatch, a mid-size SUV or a people mover. That's exactly where the tested data earns its keep, because two hybrids with near-identical labels can behave very differently on a real commute.
Carbarn stocks a range of used hybrids and fuel-efficient models in Australia, many of which appear in the published test results. If you're looking at a Japan-sourced vehicle, we're happy to talk through how the equivalent local model performed before you commit to anything.
Wrapping Up
The gap between claimed and real-world fuel economy is real, measured across nearly 200 Australian vehicles, and it varies enormously by model. The key takeaways:
- The gap exists by design — the lab test strips out variables to keep results comparable, not to mislead
- It varies widely: from +35% over claim (Mazda 2) to −22% under (Ford Mustang GT)
- Hybrids are not automatically better — some miss their label by a third
- Checking is free and takes two minutes at realworld.org.au
Make it part of your shortlist process, right alongside the price and the service history.